

Job Quality Indicators » International Comparisons of Job Quality
<< Back to list of all indicators
Balancing Work and Family Commitments |
||||||||||||||||||||||||||||||||||||||||||||||||||||||||||||||||||||||||||||||||||||||||||||||||||||||||||||||||||||||||||||||||||||||||||||||||||||||||||||||||||||||||||||||||||||||||||||
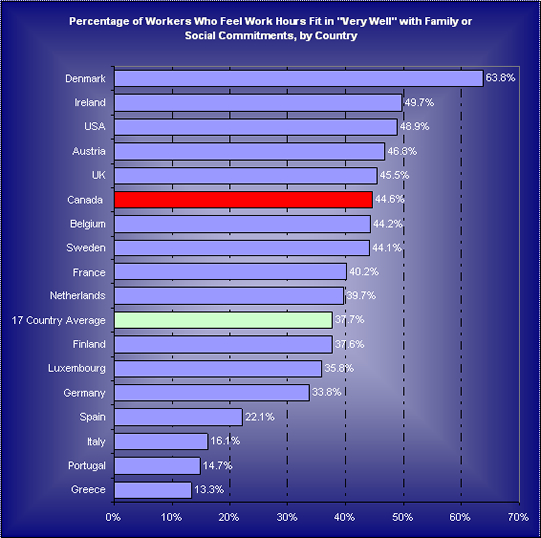
On average, across all 17 countries, 40 percent of workers feel that their working hours fit in “very well” with their family and social commitments. Denmark had the highest rating with 64 percent of workers reporting work fitting in “very well” with family. Countries in southern Europe have the lowest ratings of overall satisfaction with work hours and family balance. Canada ranks sixth in terms of overall satisfaction (45 percent), slightly lower than the satisfaction reported by U.S. workers (49 percent) but higher than the overall average (39 percent). |
||||||||||||||||||||||||||||||||||||||||||||||||||||||||||||||||||||||||||||||||||||||||||||||||||||||||||||||||||||||||||||||||||||||||||||||||||||||||||||||||||||||||||||||||||||||||||||
Almost 40 Percent of Workers Feel That |
||||||||||||||||||||||||||||||||||||||||||||||||||||||||||||||||||||||||||||||||||||||||||||||||||||||||||||||||||||||||||||||||||||||||||||||||||||||||||||||||||||||||||||||||||||||||||||
 |
||||||||||||||||||||||||||||||||||||||||||||||||||||||||||||||||||||||||||||||||||||||||||||||||||||||||||||||||||||||||||||||||||||||||||||||||||||||||||||||||||||||||||||||||||||||||||||
Data for Europe from the Third European Study on Working Conditions 2000 (ESWC). Data for Canada and the U.S. from Ekos Rethinking North American Integration Survey (ERNAIS), 2002. |
||||||||||||||||||||||||||||||||||||||||||||||||||||||||||||||||||||||||||||||||||||||||||||||||||||||||||||||||||||||||||||||||||||||||||||||||||||||||||||||||||||||||||||||||||||||||||||
While you might expect total annual hours worked, or weekly hours worked, to be negatively correlated with workers reporting work-life balance, some of the data seem to suggest otherwise. For example, workers in the U.S., with high annual hours worked, are more likely to report that their work hours fit in “very well” with family or social commitments outside work than workers in the Netherlands, Sweden, France, or Germany – all with lower annual hours worked. One might expect such differences to reflect employer policies and practices, with greater flexibility and family-supportive programs assisting in work-life balance, despite longer work hours. However, family-friendly work practices, generally, are more commonly found in Europe than in North America. This suggests that the differences we observe more likely reflect cultural differences between countries in worker expectations about work-life balance. |
||||||||||||||||||||||||||||||||||||||||||||||||||||||||||||||||||||||||||||||||||||||||||||||||||||||||||||||||||||||||||||||||||||||||||||||||||||||||||||||||||||||||||||||||||||||||||||
By Employment Status, Gender, and Age |
||||||||||||||||||||||||||||||||||||||||||||||||||||||||||||||||||||||||||||||||||||||||||||||||||||||||||||||||||||||||||||||||||||||||||||||||||||||||||||||||||||||||||||||||||||||||||||
|
||||||||||||||||||||||||||||||||||||||||||||||||||||||||||||||||||||||||||||||||||||||||||||||||||||||||||||||||||||||||||||||||||||||||||||||||||||||||||||||||||||||||||||||||||||||||||||
Data for Europe from the Third European Study on Working Conditions 2000 (ESWC). Data for Canada and the U.S. from Ekos Rethinking North American Integration Survey (ERNAIS), 2002. |
||||||||||||||||||||||||||||||||||||||||||||||||||||||||||||||||||||||||||||||||||||||||||||||||||||||||||||||||||||||||||||||||||||||||||||||||||||||||||||||||||||||||||||||||||||||||||||
Employment Status |
||||||||||||||||||||||||||||||||||||||||||||||||||||||||||||||||||||||||||||||||||||||||||||||||||||||||||||||||||||||||||||||||||||||||||||||||||||||||||||||||||||||||||||||||||||||||||||
On average, more workers who are employees report that their work hours fit in “very well” with work family balance than is the case for self-employed workers. However, this pattern is not true of all countries. Self-employed workers in Canada, Luxembourg, Netherlands, Portugal, Spain, Sweden, and the U.S. are more likely to say work hours fit in very well with family/social commitments than employees. For Canada, this result is consistent with data from the CPRN-EKOS Changing Employment Relationships Survey (2000) which finds that self-employed workers are more likely to report achieving work life balance than paid employees. Workers in the U.S. (both self-employed and paid workers) are slightly more likely than their Canadian counterparts to report that their work hours fit in very well with family/social commitments. It is notable that in Greece, where a large proportion of workers are self employed (32 percent), only 7 percent of self-employed workers report that their work hours fit in very well with their family/social commitments. We note as well that the great majority of the labour force in Greece consists of male workers, many of whom report working long hours. |
||||||||||||||||||||||||||||||||||||||||||||||||||||||||||||||||||||||||||||||||||||||||||||||||||||||||||||||||||||||||||||||||||||||||||||||||||||||||||||||||||||||||||||||||||||||||||||
Gender |
||||||||||||||||||||||||||||||||||||||||||||||||||||||||||||||||||||||||||||||||||||||||||||||||||||||||||||||||||||||||||||||||||||||||||||||||||||||||||||||||||||||||||||||||||||||||||||
Women are more likely than men to report that their working hours fit in very well with their family or social commitments. This pattern is consistent across all countries (with the exception of Portugal). The smaller proportion of women in Greece, Italy, and Spain who report that their working hours fit in very well with family/social commitment might explain the low participation rates for women in these countries. Women in these countries may simply not enter the workforce because of the difficulty in achieving a balance between work and home. In Canada, a greater share of women (48 percent) than men (42 percent) report their working hours fit in “very well” with their work hours and family/social commitments. These findings may be partly explained by the fact that more women work in part-time jobs. Analysis of data for the European countries reveals that women are much more likely to be employed part-time than men (32 percent of women versus 5.6 percent of men). Women who work part-time were much more likely to report their working hours fit in “very well” with their family/social commitments than full-time women (54 percent of part-time versus 33 percent of full-time). The data for Canada and the U.S. do not allow for closer examination of part-time employed women given the small sample size. |
||||||||||||||||||||||||||||||||||||||||||||||||||||||||||||||||||||||||||||||||||||||||||||||||||||||||||||||||||||||||||||||||||||||||||||||||||||||||||||||||||||||||||||||||||||||||||||
Age |
||||||||||||||||||||||||||||||||||||||||||||||||||||||||||||||||||||||||||||||||||||||||||||||||||||||||||||||||||||||||||||||||||||||||||||||||||||||||||||||||||||||||||||||||||||||||||||
There is no clear pattern across age categories in the 17 countries studied. In Canada, workers in the three age categories report average or higher than average levels of ability to find work–life balance. |
||||||||||||||||||||||||||||||||||||||||||||||||||||||||||||||||||||||||||||||||||||||||||||||||||||||||||||||||||||||||||||||||||||||||||||||||||||||||||||||||||||||||||||||||||||||||||||
Indicators |