

Job Quality Indicators » International Comparisons of Job Quality
<< Back to list of all indicators
Skills Match |
|||||||||||||||||||||||||||||||||||||||||||||||||||||||||||||||||||||||||||||||||||||||||||||||||||||||||||||||||||||||||||||||||||||||||||||||||||||||||||||||||||||||||||||||||||||||||||
The second indicator we examine for the skills development dimension of job quality is that of skills match. People prefer to have jobs that match their education and work experience. However, finding a job that matches one’s skills may not always be possible and workers may accept jobs that require less skill and education than they possess. |
|||||||||||||||||||||||||||||||||||||||||||||||||||||||||||||||||||||||||||||||||||||||||||||||||||||||||||||||||||||||||||||||||||||||||||||||||||||||||||||||||||||||||||||||||||||||||||
The Majority of Workers Feel Their Skills |
|||||||||||||||||||||||||||||||||||||||||||||||||||||||||||||||||||||||||||||||||||||||||||||||||||||||||||||||||||||||||||||||||||||||||||||||||||||||||||||||||||||||||||||||||||||||||||
 |
|||||||||||||||||||||||||||||||||||||||||||||||||||||||||||||||||||||||||||||||||||||||||||||||||||||||||||||||||||||||||||||||||||||||||||||||||||||||||||||||||||||||||||||||||||||||||||
Source: Data for Europe from the Third European Study on Working Conditions 2000 (ESWC). Data for Canada and the U.S. from Ekos Rethinking North American Integration Survey (ERNAIS), 2002. |
|||||||||||||||||||||||||||||||||||||||||||||||||||||||||||||||||||||||||||||||||||||||||||||||||||||||||||||||||||||||||||||||||||||||||||||||||||||||||||||||||||||||||||||||||||||||||||
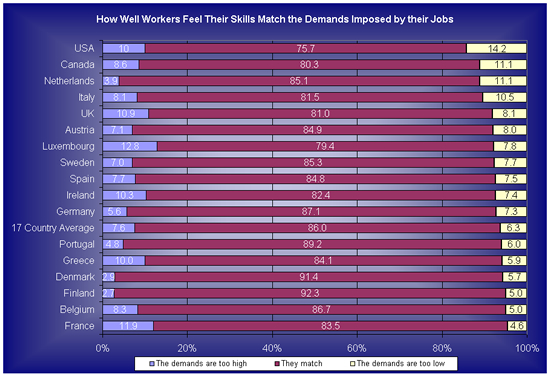
Overall, the majority of workers (84 percent) feel that their skills match the demands of their current jobs, but with variation across the 17 countries studied. Workers in Finland are most likely to report feeling that their skills match their current jobs (92 percent) while those in the U.S. are least likely to report a good match (76 percent). Eighty percent of Canadian workers say they feel that their skills match the demands imposed by their jobs. |
|||||||||||||||||||||||||||||||||||||||||||||||||||||||||||||||||||||||||||||||||||||||||||||||||||||||||||||||||||||||||||||||||||||||||||||||||||||||||||||||||||||||||||||||||||||||||||
Feelings of Overqualification |
|||||||||||||||||||||||||||||||||||||||||||||||||||||||||||||||||||||||||||||||||||||||||||||||||||||||||||||||||||||||||||||||||||||||||||||||||||||||||||||||||||||||||||||||||||||||||||
With respect to the issue of over-skilling or overqualification, on average only 8 percent of workers (in all 17 countries) report that they feel the demands of their jobs are below their skill level, that is to say, they are overqualified. Feelings of overqualification are highest in the U.S. where 14 percent of workers report feeling the demands of their jobs fall short of their skills. This is followed closely by Canada and the Netherlands , with 11 percent of workers reporting feeling overqualified. |
|||||||||||||||||||||||||||||||||||||||||||||||||||||||||||||||||||||||||||||||||||||||||||||||||||||||||||||||||||||||||||||||||||||||||||||||||||||||||||||||||||||||||||||||||||||||||||
By Employment Status, Gender, and Age |
|||||||||||||||||||||||||||||||||||||||||||||||||||||||||||||||||||||||||||||||||||||||||||||||||||||||||||||||||||||||||||||||||||||||||||||||||||||||||||||||||||||||||||||||||||||||||||
|
|||||||||||||||||||||||||||||||||||||||||||||||||||||||||||||||||||||||||||||||||||||||||||||||||||||||||||||||||||||||||||||||||||||||||||||||||||||||||||||||||||||||||||||||||||||||||||
Source: Data for Europe from the Third European Study on Working Conditions 2000 (ESWC). Data for Canada and the U.S. from Ekos Rethinking North American Integration Survey (ERNAIS), 2002. |
|||||||||||||||||||||||||||||||||||||||||||||||||||||||||||||||||||||||||||||||||||||||||||||||||||||||||||||||||||||||||||||||||||||||||||||||||||||||||||||||||||||||||||||||||||||||||||
Employment Status |
|||||||||||||||||||||||||||||||||||||||||||||||||||||||||||||||||||||||||||||||||||||||||||||||||||||||||||||||||||||||||||||||||||||||||||||||||||||||||||||||||||||||||||||||||||||||||||
Employed workers report feeling overqualified more often than self-employed workers, a pattern that is consistent across all 17 countries, with the exception of Germany and Luxembourg. In Canada , 12 percent of employed workers feel overqualified for their jobs compared to 9 percent of self-employed workers. A similar pattern is found in the U.S., with 15 percent of employed workers feeling overqualified for their jobs, compared to 11 percent of self-employed workers. |
|||||||||||||||||||||||||||||||||||||||||||||||||||||||||||||||||||||||||||||||||||||||||||||||||||||||||||||||||||||||||||||||||||||||||||||||||||||||||||||||||||||||||||||||||||||||||||
Gender |
|||||||||||||||||||||||||||||||||||||||||||||||||||||||||||||||||||||||||||||||||||||||||||||||||||||||||||||||||||||||||||||||||||||||||||||||||||||||||||||||||||||||||||||||||||||||||||
On average, women are very slightly more likely than men to report that they feel overqualified in the 17 countries studied (8.1 percent of women versus 7.6 percent of men). However this pattern is not consistent in all countries. Men report feeling overqualified more often than women in Austria, Canada, Denmark, Spain , the U.K. , and the U.S. Both male and female workers in the U.S. are more likely to report over-skilling than their Canadian counterparts, although the gap is larger for men (17 percent of men in U.S. versus 13 percent in Canada ; 12 percent of women in U.S. versus 9 percent in Canada). |
|||||||||||||||||||||||||||||||||||||||||||||||||||||||||||||||||||||||||||||||||||||||||||||||||||||||||||||||||||||||||||||||||||||||||||||||||||||||||||||||||||||||||||||||||||||||||||
Age |
|||||||||||||||||||||||||||||||||||||||||||||||||||||||||||||||||||||||||||||||||||||||||||||||||||||||||||||||||||||||||||||||||||||||||||||||||||||||||||||||||||||||||||||||||||||||||||
Young workers (under 25 years of age) are most likely to report feeling overqualified for their jobs. This pattern is consistent across all countries, with the exception of Germany and Luxembourg. At almost 25 per cent, the feeling of being overqualified is highest for youth in Canada. Young workers in the U.S. rank second in this regard. One explanation for why youth are more likely to feel overqualified for their jobs is that many of them work part-time in the service sector while in school, and often in retail and food services, where skill requirements tend to be lower. However, it is interesting to note that although 42 percent of employed youth in Denmark worked part-time, similar to the rate in Canada, only 9 percent of them feel overqualified for their jobs. |
|||||||||||||||||||||||||||||||||||||||||||||||||||||||||||||||||||||||||||||||||||||||||||||||||||||||||||||||||||||||||||||||||||||||||||||||||||||||||||||||||||||||||||||||||||||||||||
Indicators |