

Job Quality Indicators » International Comparisons of Job Quality
<< Back to list of all indicators
Working with Computers |
|||||||||||||||||||||||||||||||||||||||||||||||||||||||||||||||||||||||||||||||||||||||||||||||||||||||||||||||||||||||||||||||||||||||||||||||||||||||||||||||||||||||||||||||||||||||||||
The ability and opportunity to use a computer is clearly vital to workers in the new economy. While not all computer work involves high-level skills, computers do give workers an opportunity to develop such skills and to access and process information more effectively. |
|||||||||||||||||||||||||||||||||||||||||||||||||||||||||||||||||||||||||||||||||||||||||||||||||||||||||||||||||||||||||||||||||||||||||||||||||||||||||||||||||||||||||||||||||||||||||||
Over Half of Workers Use a Computer at Work |
|||||||||||||||||||||||||||||||||||||||||||||||||||||||||||||||||||||||||||||||||||||||||||||||||||||||||||||||||||||||||||||||||||||||||||||||||||||||||||||||||||||||||||||||||||||||||||
 |
|||||||||||||||||||||||||||||||||||||||||||||||||||||||||||||||||||||||||||||||||||||||||||||||||||||||||||||||||||||||||||||||||||||||||||||||||||||||||||||||||||||||||||||||||||||||||||
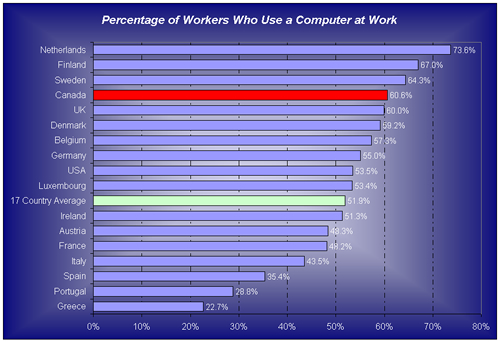
On average, over half of the workforce (52 percent) uses a computer at work at least occasionally. However, examination of computer use reveals large differences across countries. The proportion of workers using a computer on the job is particularly high in northern Europe and North America and low in the southern European countries of Greece and Portugal . These differences reflect differences in the industrial structure of the economies in each country. Canada has one of the highest rates of computer use at work, with 61 percent of Canadian workers reporting using a computer at work in 2002 (the 4th highest rate of computer use at work); this compares with the 17-country average of 52 percent and the U.S. average of 53.5 percent. The Netherlands ranks highest of all the countries with almost 74 percent of respondents using computers at work. |
|||||||||||||||||||||||||||||||||||||||||||||||||||||||||||||||||||||||||||||||||||||||||||||||||||||||||||||||||||||||||||||||||||||||||||||||||||||||||||||||||||||||||||||||||||||||||||
By Employment Status, Gender, and Age |
|||||||||||||||||||||||||||||||||||||||||||||||||||||||||||||||||||||||||||||||||||||||||||||||||||||||||||||||||||||||||||||||||||||||||||||||||||||||||||||||||||||||||||||||||||||||||||
|
|||||||||||||||||||||||||||||||||||||||||||||||||||||||||||||||||||||||||||||||||||||||||||||||||||||||||||||||||||||||||||||||||||||||||||||||||||||||||||||||||||||||||||||||||||||||||||
Employment Status |
|||||||||||||||||||||||||||||||||||||||||||||||||||||||||||||||||||||||||||||||||||||||||||||||||||||||||||||||||||||||||||||||||||||||||||||||||||||||||||||||||||||||||||||||||||||||||||
Overall, paid employees are more likely to use a computer at work than are the self-employed. This pattern is consistent for most countries with the exception of Austria, Denmark, Germany, and the Netherlands. On average, over half of paid workers (53 percent) report using a computer at work compared to 46 percent of self-employed workers. Data for Canada fit the pattern, with 57 per cent of employed workers and 52 percent of self-employed workers using computers at work. |
|||||||||||||||||||||||||||||||||||||||||||||||||||||||||||||||||||||||||||||||||||||||||||||||||||||||||||||||||||||||||||||||||||||||||||||||||||||||||||||||||||||||||||||||||||||||||||
Gender |
|||||||||||||||||||||||||||||||||||||||||||||||||||||||||||||||||||||||||||||||||||||||||||||||||||||||||||||||||||||||||||||||||||||||||||||||||||||||||||||||||||||||||||||||||||||||||||
On average, men and women are equally likely to use a computer at work. This is true of most of the 17 countries. Women in Canada , Greece, Ireland, Spain, Sweden, and the U.S. are more likely to report using a computer at work than men in those countries. In the Netherlands, the reverse is true. Men in Canada are more likely to use a computer at work than men in the U.S. (57.2 percent versus 47.9 percent) The gap is smaller between female workers in Canada and the U.S., with those in Canada being slightly more likely to use a computer at work (64 percent in Canada versus 60 percent in the U.S.). |
|||||||||||||||||||||||||||||||||||||||||||||||||||||||||||||||||||||||||||||||||||||||||||||||||||||||||||||||||||||||||||||||||||||||||||||||||||||||||||||||||||||||||||||||||||||||||||
Age |
|||||||||||||||||||||||||||||||||||||||||||||||||||||||||||||||||||||||||||||||||||||||||||||||||||||||||||||||||||||||||||||||||||||||||||||||||||||||||||||||||||||||||||||||||||||||||||
Two age groups - younger workers (under 25 years of age) and older workers (45-64 years of age) - are less likely to use a computer at work than is the core group of workers (ages 25 to 44). A similar pattern is observed among the 17 countries, except for Belgium and Luxembourg. In Canada , computer use by younger workers, at 42 percent, equals the 17 country average. This is higher than computer use among younger workers in the U.S. (35 percent). The lower rate of computer use among younger workers in Canada and the U.S. compared to workers aged 25 years or more is likely a result of the fact that many of the jobs for this age group are found in the service sector (e.g., retail and restaurant jobs) which may not afford as much opportunity to use computers in the workplace. Workers in the core age group (25 to 44) in Canada report higher computer use at work than those in the U.S. (66 percent versus 58 percent). Given the similarities in the age composition of the workforces in Canada and the U.S., the data suggest that workers in the core age group in Canada have a greater opportunity than those in the U.S. to develop new computer skills and benefit from the use of a computer at work. Older workers in Canada and the U.S. report similar levels of computer use at work, at around 58 percent. These findings are encouraging in light of the issue of workforce ageing. Many of these workers, in fact, have been part of the spread of computer technology in the workplace and are as comfortable with computers as a workplace tool as many younger workers. |
|||||||||||||||||||||||||||||||||||||||||||||||||||||||||||||||||||||||||||||||||||||||||||||||||||||||||||||||||||||||||||||||||||||||||||||||||||||||||||||||||||||||||||||||||||||||||||
Indicators |