

Job Quality Indicators » International Comparisons of Job Quality
<< Back to list of all indicators
Incidence of Temporary Employment |
||||||||||||||||||||||||||||||||||||||||||||||||||||||||||||||||||||||||||||||||||||||||||||||||||||||||||||||||||||||||||||||||||||||||||||||||||||||||
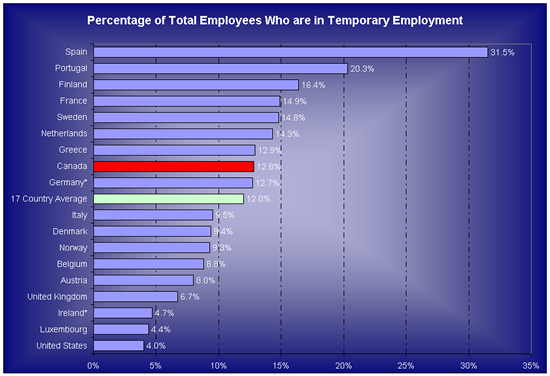
The chart below presents data on the incidence of temporary employment in the 17 countries studied. The incidence of temporary employment ranges from a low of 4 percent in the U.S. to a high of 31.5 percent in Spain. Canada ranks in the middle of the pack. The proportion of temporary employment in Canada is more than three times that of the U.S. |
||||||||||||||||||||||||||||||||||||||||||||||||||||||||||||||||||||||||||||||||||||||||||||||||||||||||||||||||||||||||||||||||||||||||||||||||||||||||
Canada has Three Times More Employees Who |
||||||||||||||||||||||||||||||||||||||||||||||||||||||||||||||||||||||||||||||||||||||||||||||||||||||||||||||||||||||||||||||||||||||||||||||||||||||||
 |
||||||||||||||||||||||||||||||||||||||||||||||||||||||||||||||||||||||||||||||||||||||||||||||||||||||||||||||||||||||||||||||||||||||||||||||||||||||||
The gap between Canada and the U.S. in terms of the incidence of involuntary part-time work and temporary work may translate into lower job quality for workers in these jobs. Involuntary part-time employment represents a form of under-employment. It reflects a worker’s dissatisfaction with an insufficient number of hours in their job. Temporary employment is also usually less desirable for workers than is permanent employment. Workers who are unable to find more stable jobs may expose themselves to recurrent spells of unemployment and this may compromise their access to employer sponsored training, which can play a key role in career advancement (OECD 2002). Analysis of data on workers in Europe that compared temporary workers with permanent workers finds that temporary workers fare worse on a number of job quality indicators. For example, temporary workers are less satisfied with their working conditions, more likely to report continuously working at high speed, and less likely to report receiving employer sponsored training than permanent workers. Data for workers in Canada and the U.S. do not allow for examination of job quality of temporary workers. A possible explanation for the differences observed across countries in the percentage of workers who are considered to be in temporary jobs might be related to issues of employment protection. Employment protection refers to regulations concerning both hiring (e.g. conditions for using temporary or fixed-term contracts) and firing (e.g. lay-off procedures, notification periods) (OECD, 1999)[1]. The OECD has developed indicators measuring the “strictness” of employment protection legislation (EPL) in 27 OECD countries The Table below presents data on the OECD’s overall EPL indicator across the 17 countries studied. The higher the indicator, the more employment protection legislation is found in each country. There is significant variation in the overall level of EPL strictness. Countries in southern Europe stand out for having relatively strict employment protection, particularly Spain and Portugal . Those countries are also found to have the highest incidence of temporary employment of all the countries studied. This suggests that in countries with strict employment protection legislation, employers will hire more workers on a temporary basis to avoid employment legislation regulation. In comparison, we find regulation is least restrictive in the United States , which also has the lowest incidence of temporary employment of the 17 countries studied. The U.S. has weaker employment protection legislation than many other OECD countries; therefore, U.S. employers have less need to employ people on a non-standard basis as a way of avoiding costs associated with statutory protection of regular, full-time employees. Canada has one of the lowest EPL indicators, suggesting less restrictive legislation, but still higher than that found in the U.S. This may partially explain the greater incidence of temporary employment in Canada compared with the U.S. |
||||||||||||||||||||||||||||||||||||||||||||||||||||||||||||||||||||||||||||||||||||||||||||||||||||||||||||||||||||||||||||||||||||||||||||||||||||||||
|
||||||||||||||||||||||||||||||||||||||||||||||||||||||||||||||||||||||||||||||||||||||||||||||||||||||||||||||||||||||||||||||||||||||||||||||||||||||||
Source: OECD Employment Outlook 1999 . Paris : OECD |
||||||||||||||||||||||||||||||||||||||||||||||||||||||||||||||||||||||||||||||||||||||||||||||||||||||||||||||||||||||||||||||||||||||||||||||||||||||||
By Gender and Age |
||||||||||||||||||||||||||||||||||||||||||||||||||||||||||||||||||||||||||||||||||||||||||||||||||||||||||||||||||||||||||||||||||||||||||||||||||||||||
|
||||||||||||||||||||||||||||||||||||||||||||||||||||||||||||||||||||||||||||||||||||||||||||||||||||||||||||||||||||||||||||||||||||||||||||||||||||||||
Gender |
||||||||||||||||||||||||||||||||||||||||||||||||||||||||||||||||||||||||||||||||||||||||||||||||||||||||||||||||||||||||||||||||||||||||||||||||||||||||
On average, the incidence of temporary employment is higher for women than it is for men. This pattern is consistent across the 17 countries studied. In Canada, almost 14 percent of women and 12 percent of men are temporary workers, the middle of the pack for both groups. The incidence of temporary employment in the U.S. is much lower than in Canada for both men and women. |
||||||||||||||||||||||||||||||||||||||||||||||||||||||||||||||||||||||||||||||||||||||||||||||||||||||||||||||||||||||||||||||||||||||||||||||||||||||||
Age |
||||||||||||||||||||||||||||||||||||||||||||||||||||||||||||||||||||||||||||||||||||||||||||||||||||||||||||||||||||||||||||||||||||||||||||||||||||||||
Younger workers are much more likely to be employed on a temporary basis than older workers, a consistent pattern across all 17 countries examined. In Canada, 31 percent of young workers are in temporary jobs, similar to the 17-country average of 33%, but much higher than in the U.S. , where only 8 percent of employed youth are considered to be temporary. |
||||||||||||||||||||||||||||||||||||||||||||||||||||||||||||||||||||||||||||||||||||||||||||||||||||||||||||||||||||||||||||||||||||||||||||||||||||||||
Indicators |