

Job Quality Indicators » Gender and Job Quality
<< Back to list of all indicators
Job Value Scales |
||||||||||||
In the previous section, Highly Valued Job Features, data were presented on what women and men value in a job based on 17 questions from the CPRN-EKOS Changing Employment Relationships Survey (CERS). To simplify the analysis of these results, Hughes, Lowe, and Schellenberg combined questions on related issues from the 17 job value items into five job value scales:
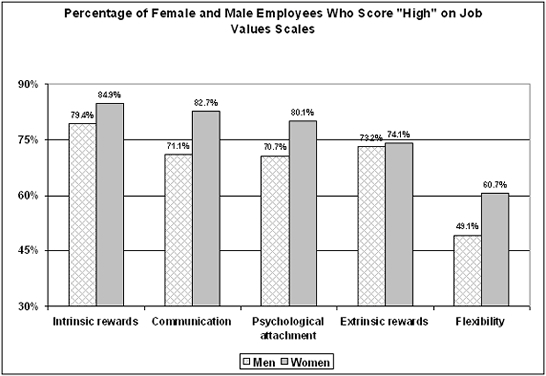
As the chart below shows, a majority of Canadian workers value intrinsic rewards. These findings suggest that for most, a job is far more than a paycheque. Interesting work, feelings of accomplishment and opportunities to learn are key components of what is valued in a job. Slightly more women than men scored high on this job value scale. Women rank communication and social relationships as highly important 12 percentage points higher than men. This supports research that shows women place particular value on having strong communication in the workplace as well as friendly and supportive co-workers. A larger share of women than men also place high value on the psychological aspect of work, specifically commitment and respect. When it comes to valuing extrinsic job rewards, men and women reported similar results. However, a much larger share of women than men place high value on job flexibility and the ability to balance work and family life. This no doubt reflects the greater burden that women continue to bear regarding childcare and house-hold responsibilities. |
||||||||||||
Women are more likely than Men to Place High Value On Communication, Flexibility and Psychological Attachment |
||||||||||||
|
||||||||||||
Source: CPRN-Ekos Changing Employment Relationships Survey. Paid employees only (n=2118). Reprinted from Hughes, Lowe, and Schellenberg (2003). |
||||||||||||
Job Value Scales by Education |
||||||||||||
Does education have an impact on job values for men and women? To answer this question, the table below presents a comparison between female and male employees in three educational groups – those with high school or less, those with a non-university post-secondary certificate or diploma, and those with a university degree. On many of the job value scales, gender differences are smallest among women and men with high school education or less and are largest among those with a university degree. |
||||||||||||
Differences in What Women and Men Want in a Job |
||||||||||||
|
||||||||||||
Source: CPRN-Ekos Changing Employment Relationships Survey. Paid employees only (n=2118). For each of the five scales, the table reports the percentage-point difference between the proportion of females, compared to males, who score 9 or 10 on a scale with a minimum value of 2 and a maximum value of 10. Reprinted from Hughes, Lowe, and Schellenberg (2003). |
||||||||||||
Additional Charts and Information |